Debugging LLM Requests
vLLora supports interactive debugging for LLM requests. When Debug Mode is enabled, vLLora pauses requests before they are sent to the model. You can inspect, edit, and continue the request. This allows you to debug agent prompts, model selection, tool schemas, and parameters in real time.
Debug Mode works by inserting breakpoints on every outgoing LLM request. When enabled, each request is paused so you can inspect, edit, or continue execution.
With Debug Mode you can:
- Inspect the model, messages, parameters, and tool schemas
- Continue with the original request
- Modify the request and send your edited version instead
Enable Debug Mode
You can enable Debug Mode directly in the vLLora UI:
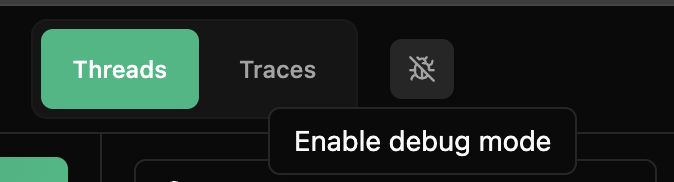
- Open the UI at
http://localhost:9091/chat. - Click the debug mode (bug) icon to turn on Debug Mode.
Once enabled, vLLora pauses every outgoing LLM request so you can inspect, edit, or continue it.
Toggle the icon again to disable Debug Mode and let requests flow normally.
Debug Mode affects all requests that flow through vLLora. There are no per-route or per-endpoint settings—when enabled, every LLM request is intercepted.
Paused Requests
When a request is paused in Debug Mode, vLLora pauses execution and displays a detailed view of the request payload. Here's what you'll see:
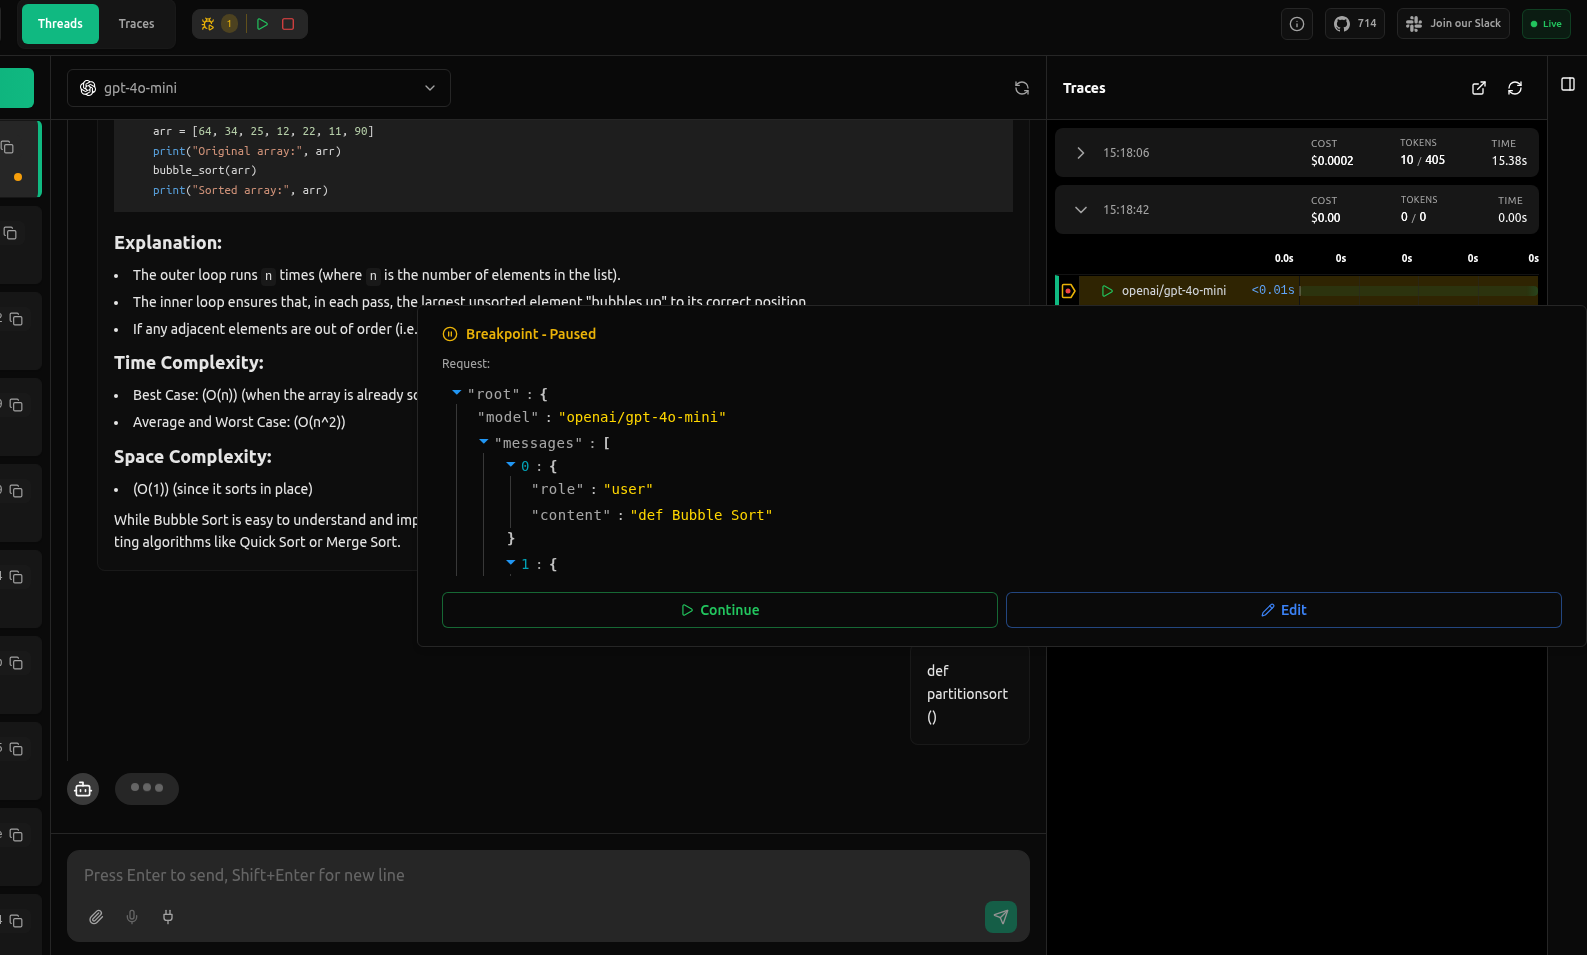
The paused view gives you a clear snapshot of the request:
- The selected model
- All messages in the request (user, system, assistant)
- Parameters like temperature or max tokens
- Any additional fields your application included
This data appears exactly as vLLora will send it to the provider.
Inspecting the Request
When you hover over a paused request in the trace view, the request payload is shown in a JSON viewer so you can quickly read through the structure. This makes it simple to confirm:
- What message content the model is receiving
- Whether parameters are set as expected
- How frameworks or middleware have transformed the request
- Whether the prompt is what you intended to send
Editing the Request
Click Edit to unlock the JSON panel. You can update any part of the payload:
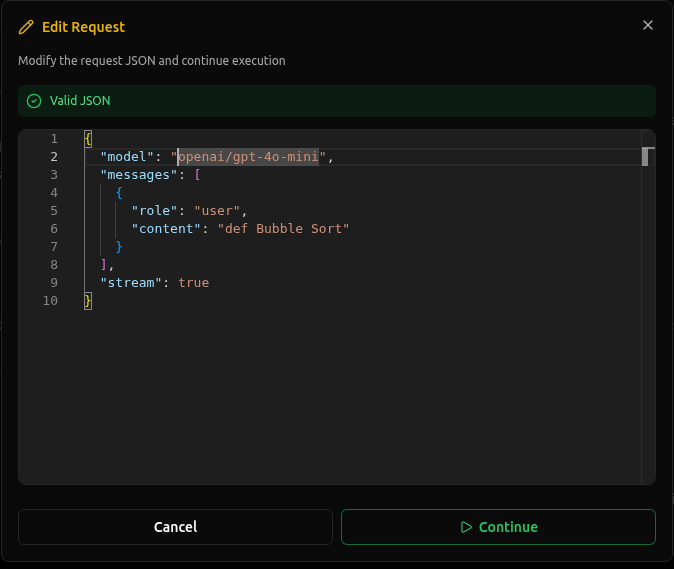
- Change the model
- Modify message content
- Adjust parameters
- Remove or add fields
Edits apply only to this request and do not modify your application code.
What Changes Happen
It's important to understand what happens when you edit a request:
- Only that specific request is modified: Your edits affect only the current paused request. The changes are not saved to your application code or configuration.
- The agent continues normally afterward: After you continue with the edited request, your agent or workflow proceeds as if the request was sent normally—just with your modifications applied.
- Does not modify application code: Your source code remains unchanged. This is purely a runtime debugging feature.
All edits are temporary and apply only to the single request being debugged. To make permanent changes, you'll need to update your application code or configuration files.
Continue Execution
After inspecting or editing a paused request, you can continue execution in two ways:
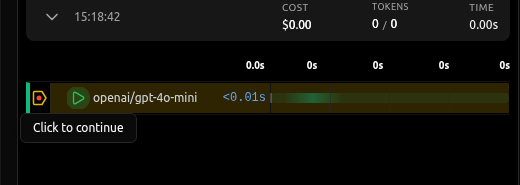
- From the top panel: Click the Continue button in the paused request panel to send the request (with any edits you made).
- From the trace view: Click "Click to continue" on a specific paused request in the trace timeline.
What Continue Does
When you click Continue:
- Sends the edited request to the model: The request payload (whether edited or unchanged) is sent to the LLM provider.
- Provides the real response from the provider: You receive the actual model response as if the request had been sent normally.
- Resumes the agent or workflow: Your agent or application continues executing as if nothing changed, using the response from the modified request.
- Shows the final output below the editor: The model's response appears in the trace view, allowing you to see the result of your edits.
Clicking Continue sends the edited request to the provider and your application resumes normally with the new response.
To disable Debug Mode and let requests flow normally, click the Stop button to turn off Debug Mode.
Interactive debugging with Debug Mode gives you complete control over LLM requests in real time. Use it to quickly diagnose issues, test parameter changes, and understand exactly what your agents are sending to models without modifying your code.