Debugging Kilocode with vLLora

Developers building coding agents need visiblity into how context is flowing through the agent, how much context is used, what tools are being called. vLLora enables you to debug all of this in real time.
Setup
Run and configure vLLora locally. Follow the Quickstart guide to get started.
brew tap vllora/vllora
brew install vllora
vllora
In KiloCode, during setup select OpenAI Compatible and set the base URL to vLLora's endpoint. For API key, use no_key as vLLora does not validate the API key, since you set API key in the vLLora UI.
Now open your code editor with KiloCode and start prompting your agent.
The Prompt
Add a customer leaderboard or loyalty points tracker component,
and embed a mini gallery section for user engagement.
When this prompt runs in KiloCode, the agent edits several files, creates new components, updates imports, and adjusts the layout to match the request.
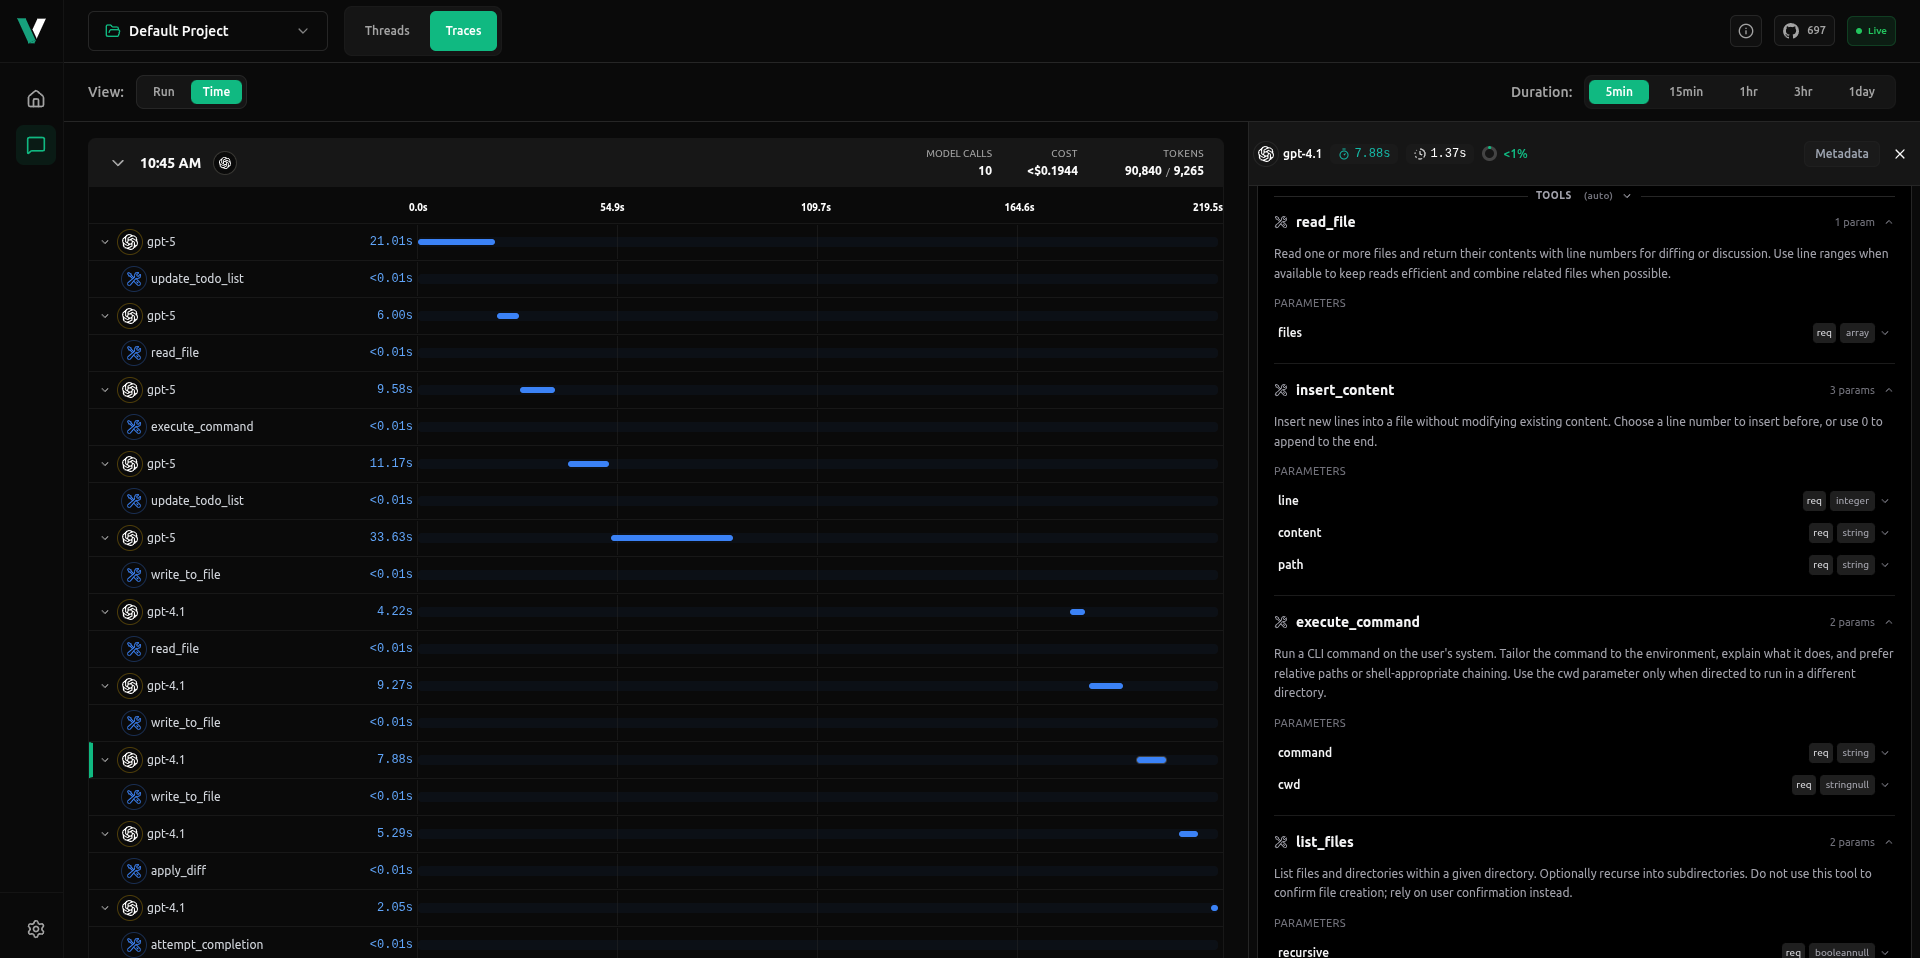
With vLLora running, we could see run involved 10 model calls and a sequence of tool executions including read_file, write_to_file, execute_command, apply_diff, and update_todo_list.
Across the session, we could see the context size steadily grow as it started with about 9,000 input tokens and reached nearly 90,000 tokens by the end as the agent read, wrote, and reloaded files.
This illustrates how coding agents like KiloCode repeatedly expand their working context as the project state evolves.
Beyond the visible tools in this trace, the underlying agent also defines a larger toolset, such as:
new_task,list_code_definition_names, andsearch_filesfor project understandinginsert_content,search_and_replace, andapply_difffor precise code editsbrowser_actionandexecute_commandfor testing and validationupdate_todo_listandattempt_completionfor managing the reasoning cycle
vLLora captures every call in sequence, showing which tools and how they were used, how much context each request consumed, and how the model responded. This experience makes debugging easier by exposing where the agent slows down, repeats steps, or mismanages context. It helps you identify issues faster, optimize performance, and build more reliable coding agents.