6 posts tagged with "Tracing"

Tracing and debugging

View All Tags

Introducing Lucy: Trace-Native Debugging Inside vLLora

· 5 min read
Mrunmay
AI Engineer

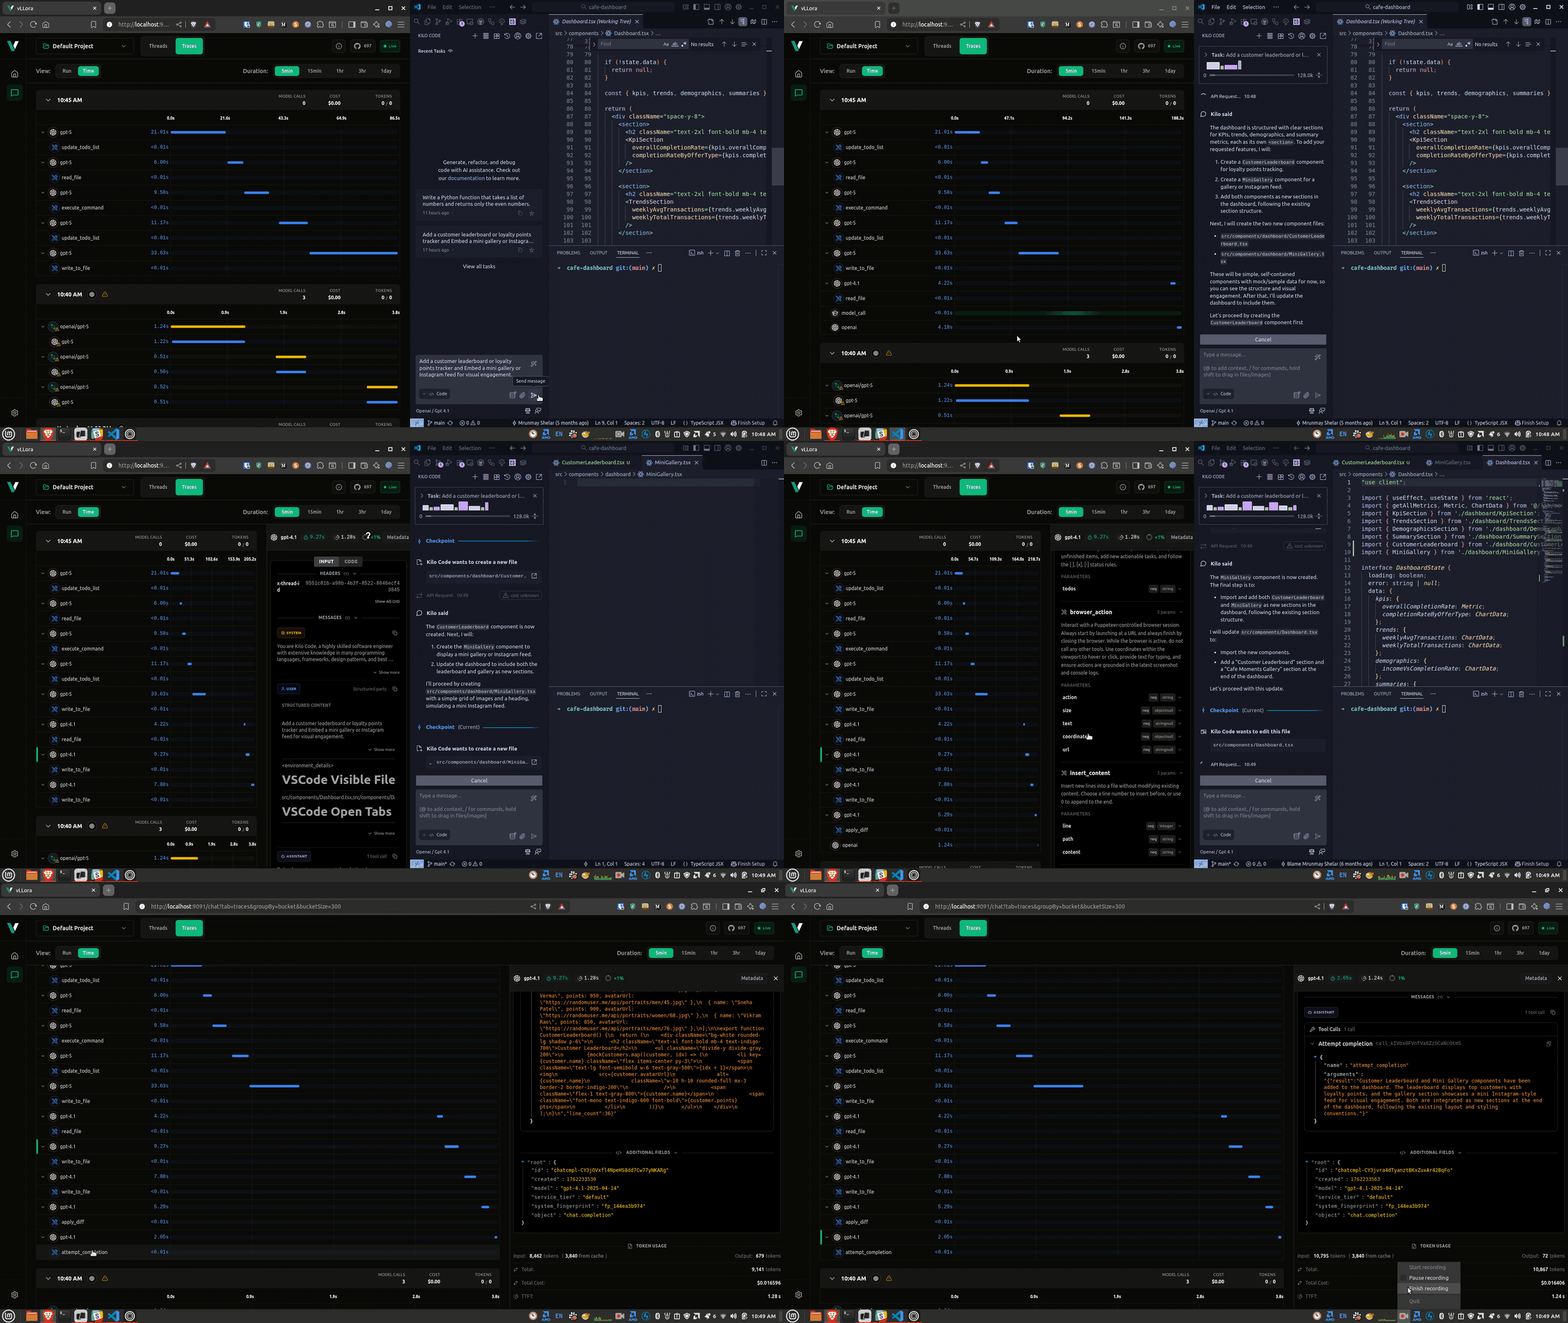
Your agent fails midway through a task. The trace is right there in vLLora, but it's 200 spans deep. You start scrolling, scanning for the red error or the suspicious tool call. Somewhere in those spans is the answer, but finding it takes longer than it should.

Today we're launching Lucy, an AI assistant built directly into vLLora that reads your traces and tells you what went wrong. You ask a question in plain English, Lucy inspects the trace, and you get a diagnosis with concrete next steps. Lucy is available now in beta.

Silent Failures: Why a “Successful” LLM Workflow Can Cost 40% More

· 9 min read
Mrunmay
AI Engineer

Your agent returns the right answer. The status is 200 OK, and the user walks away satisfied. On the surface, everything looks fine. But when you check the API bill, it doesn’t line up with how simple the task actually was.

LLMs are unusually resilient. When a tool call fails, they don’t stop execution. They try again with small variations. When a response looks off, they adjust and keep going. That behavior is often helpful, but it can also hide broken execution paths. The user sees a successful result, while your token usage quietly absorbs retries, fallbacks, and extra reasoning that never needed to happen.

Silent failures

Introducing the vLLora MCP Server

· 4 min read
Mrunmay
AI Engineer

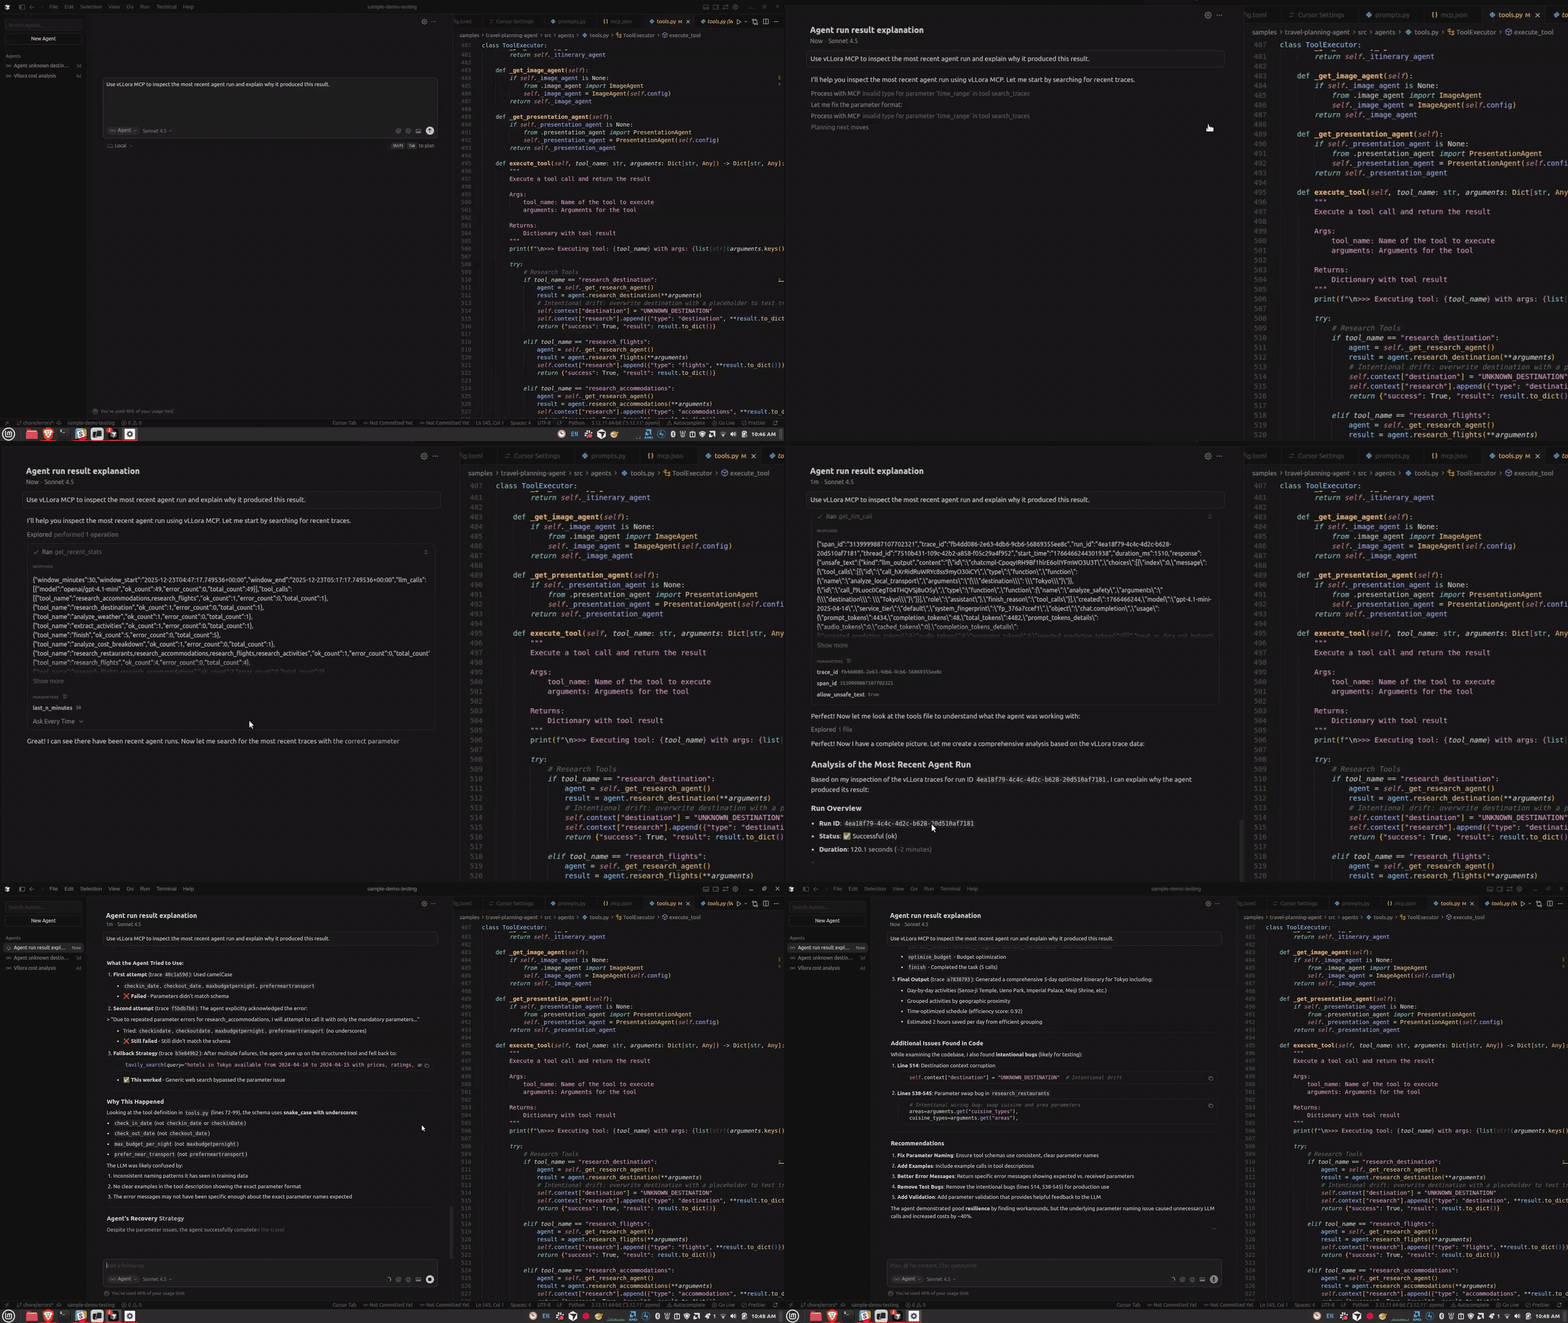
If you’re building agents with tools like Claude Code or Cursor, or you prefer working in the terminal, you’ve probably hit this friction already. Your agent runs, something breaks partway through, and now you have to context-switch to a web UI to understand what happened. You search for the right trace, click through LLM calls, and then try to carry that context back into your editor.

vLLora’s MCP Server removes that context switch. Your coding agent becomes the interface for inspecting traces, understanding failures, and debugging agent behavior — without leaving your editor or terminal.

vLLora MCP Server

Pause, Inspect, Edit: Debug Mode for LLM Requests in vLLora

· 4 min read
Mrunmay
AI Engineer

LLMs behave like black boxes. You send them a request, hope the prompt is right, hope your agent didn't mutate it, hope the framework packaged it correctly — and then hope the response makes sense. In simple one-shot queries this usually works fine. But when you're building agents, tools, multi-step workflows, or RAG pipelines, it becomes very hard to see what the model is actually receiving. A single unexpected message, parameter, or system prompt change can shift the entire run.

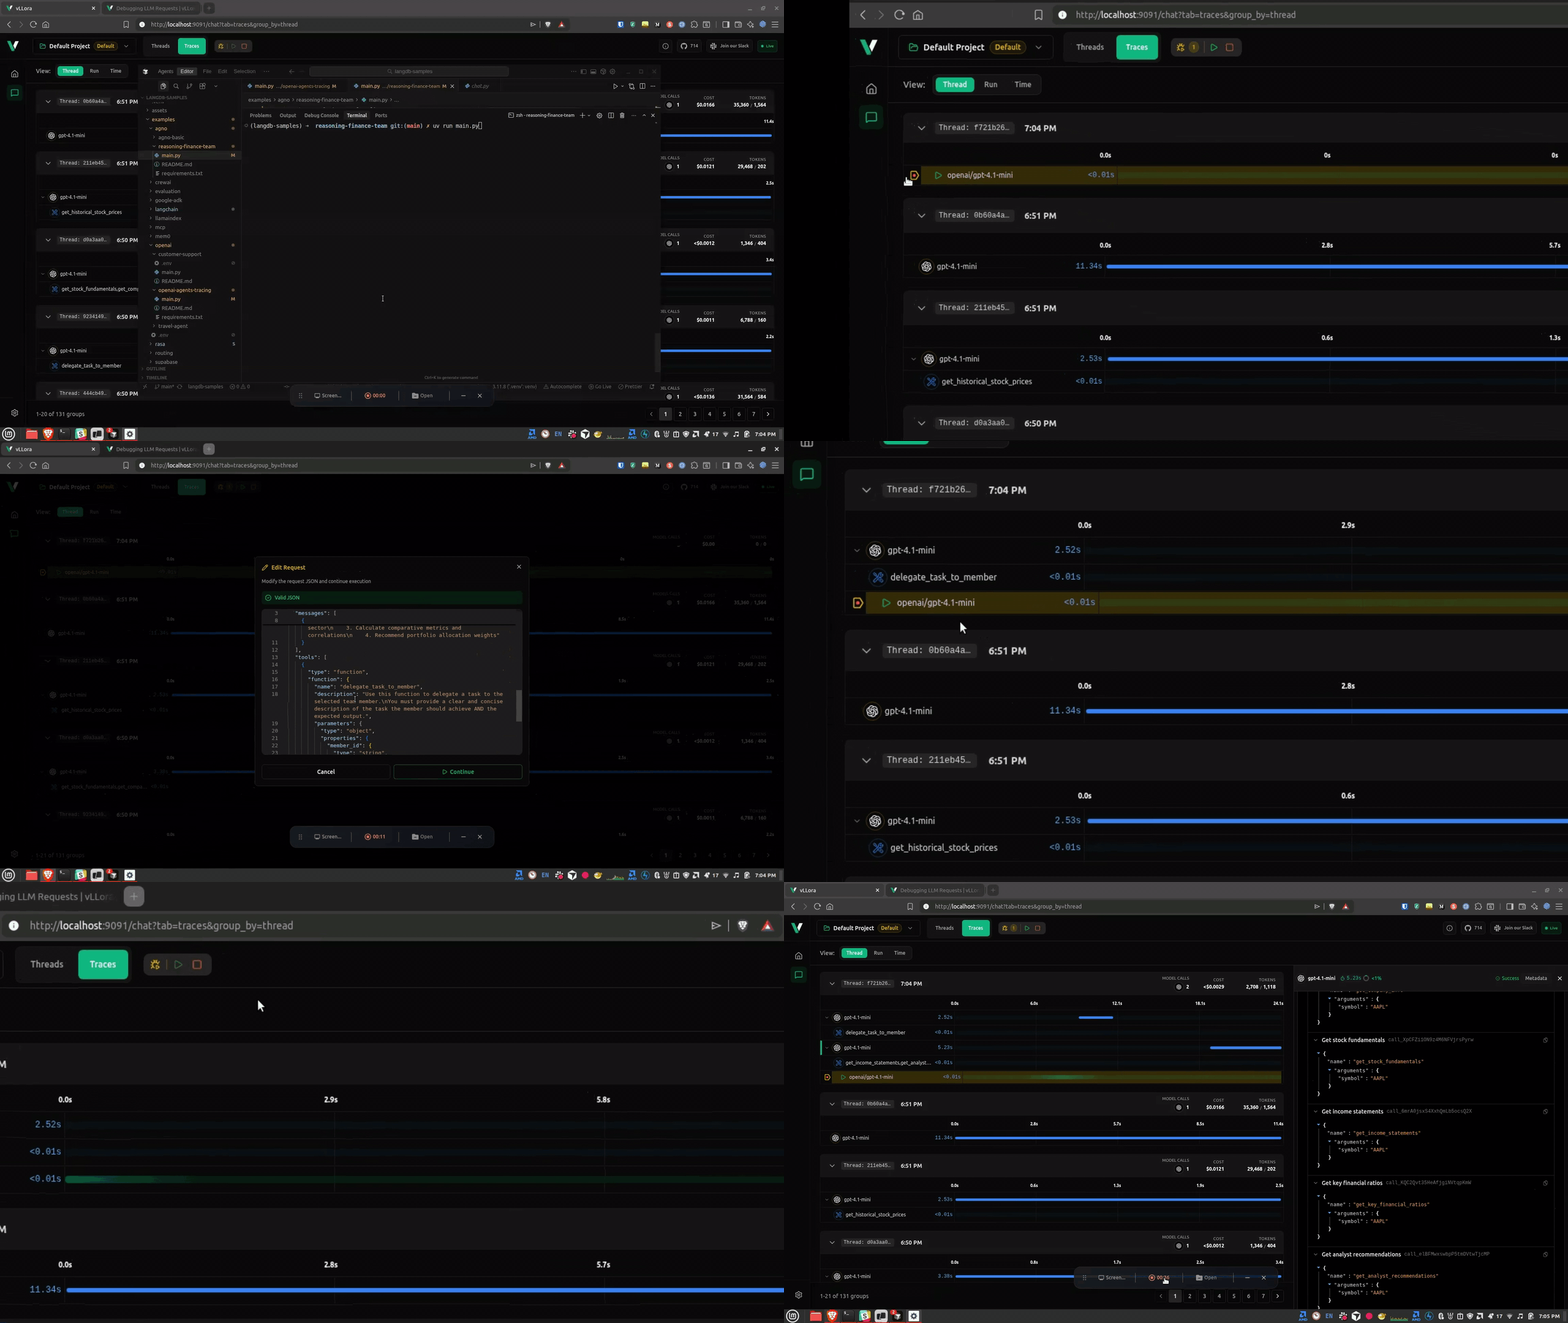
Today we're introducing Debug Mode for LLM requests in vLLora that makes this visible — and editable.

Here’s what debugging looks like in practice:

Debugging LLM Request using Debug Mode

Debugging LiveKit Voice Agents with vLLora

· 2 min read
Matteo Pelati
Matteo Pelati

Voice agents built with LiveKit Agents enable real-time, multimodal AI interactions that can handle voice, video, and text. These agents power everything from customer support bots to telehealth assistants, and debugging them requires visibility into the complex pipeline of speech-to-text, language model, and text-to-speech interactions.

In this video, we go over how you can debug voice agents built using LiveKit Agents with vLLora. You'll see how to trace every model call, tool execution, and response as your agent processes real-time audio streams.