Introducing the vLLora MCP Server

If you’re building agents with tools like Claude Code or Cursor, or you prefer working in the terminal, you’ve probably hit this friction already. Your agent runs, something breaks partway through, and now you have to context-switch to a web UI to understand what happened. You search for the right trace, click through LLM calls, and then try to carry that context back into your editor.
vLLora’s MCP Server removes that context switch. Your coding agent becomes the interface for inspecting traces, understanding failures, and debugging agent behavior — without leaving your editor or terminal.
Making Traces Programmatic
vLLora already captures detailed traces for every agent run — model calls, tool executions, and execution flow — and the web UI remains a powerful way to explore that data.
But not every debugging workflow fits a dashboard. If you’re working from the terminal, iterating inside an IDE, or using a coding agent to help debug another agent, you need trace data where that work happens. You need structured access that tools and agents can consume directly.
Built for Coding Agents
When you're building AI agents that need debugging, you shouldn't have to leave your coding environment to inspect traces.
Your coding agent already understands MCP. When you connect vLLora's MCP server, your agent immediately knows how to use the trace inspection tools. The JSON schemas are built into the protocol, so your agent understands what parameters each tool needs and what it returns.
For a complete list of available tools and prompts, see the MCP Server documentation.
The "Something Just Failed" Workflow
You run your agent and it produces an unexpected result. You need to debug it.
Instead of opening a tracing UI, you ask your coding agent to help debug it. The agent can:
- locate recent failing runs
- walk execution flow across spans
- inspect the exact payload sent to the model
The agent handles the underlying queries and returns the context you need — while you stay in your editor.
Debugging in Practice
Here’s what debugging looks like once the MCP server is connected.
An agent run completes, but keeps failing in the same way. The agent believes it’s fixing the issue by retrying with different parameter names, but the failures persist.
You ask your coding agent:
Use vLLora MCP to inspect the most recent agent run and explain why it produced this result.
The agent searches recent traces, follows the execution flow, and inspects the tool call spans. It finds repeated calls like:
{
  "tool": "research_flights",
  "arguments": {
    "from_city": "NYC",
    "to_city": "SFO",
    "departure_date": "2025-02-20"
  }
}
From the trace data, the agent sees that from_city is not a valid parameter in the registered tool schema. Because the argument names don’t match the schema exposed at runtime, the function never executes — every retry fails before the tool logic runs.
Instead of guessing, the agent explains the root cause directly from execution data: a mismatch between the agent’s assumed parameter names and the actual tool definition.
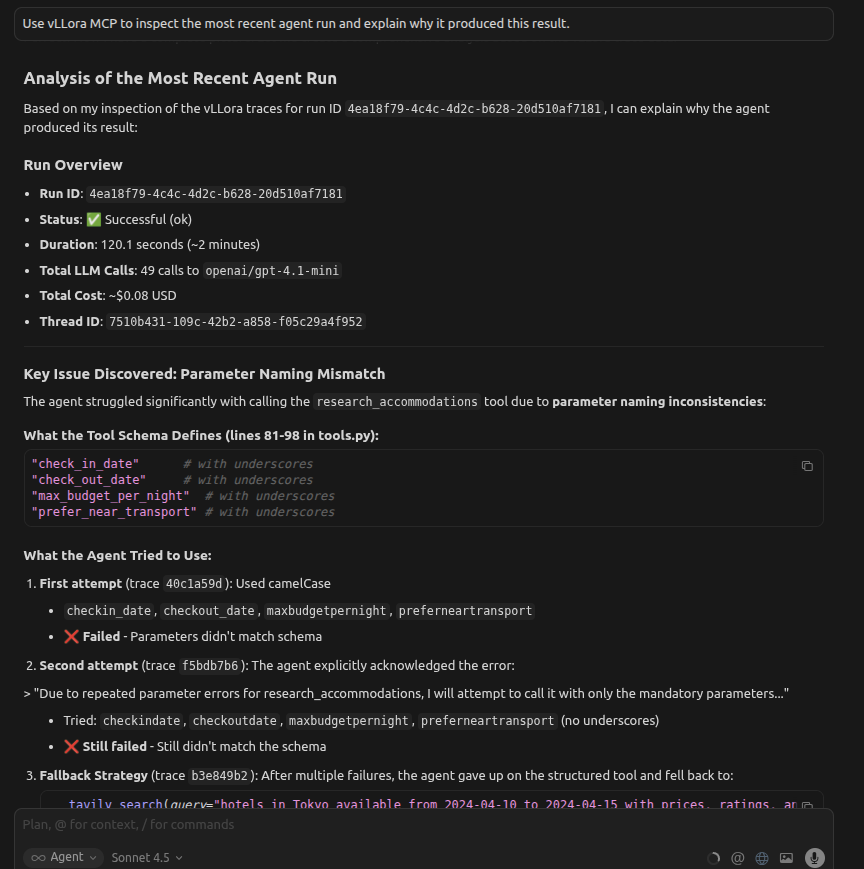
You get a clear explanation of why retries didn’t help and what needs to change, without leaving your editor or inspecting raw logs.
Connecting the MCP Server
vLLora's MCP server runs alongside your vLLora instance. Configure your MCP client to connect to it:
{
  "mcpServers": {
    "vllora": {
      "url": "http://localhost:9090/mcp"
    }
  }
}
or install the MCP server in your IDE:
Quick Install

Once connected, your coding agent automatically discovers the trace inspection tools and can start using them.
Closing Thoughts
Debugging AI agents has been tedious—too much context switching, too little visibility into what's happening. vLLora's MCP Server brings trace inspection into your coding workflow, so you can debug agents the same way you debug code: in your editor, with your tools.
This brings observability closer to where agent reasoning happens.
For setup details and advanced configuration, see the vLLora MCP Server documentation.